Employee Engagement Statistics & Data to Know in 2026

Jun 11, 2026
Chart of employee engagement statistics showing global and U.S. engagement rates for 2026.

Content

Employee engagement statistics paint a stark picture: engagement keeps shrinking, and the price tag keeps growing. Global engagement now sits at only 20%, the lowest point in years, and the dip costs the world economy roughly $10 trillion in lost productivity each year [1]. In the United States, engagement has dropped to 31% and shows no signs of bouncing back to its 2020 peak [3]. Managers, who shape engagement more than any other workplace factor, are checking out faster than the people they lead [1].

We pulled together 36 employee engagement statistics from primary research by Gallup, McKinsey, Deloitte, Microsoft, the U.S. Bureau of Labor Statistics, and The Conference Board. The data is grouped into nine categories so HR leaders, executives, and people teams can jump straight to engagement rates, business impact, manager influence, recognition, remote work, wellbeing, generational trends, or the role of AI. Every stat links back to its primary source.

The picture is sobering. It also points to a clear opportunity. Best-practice organizations still hit engagement levels around 70%, and the gap between those workplaces and everyone else explains most of the trillion-dollar swing in productivity that engagement controls [1].

The Current State of Employee Engagement

Global engagement is at its lowest point in years.
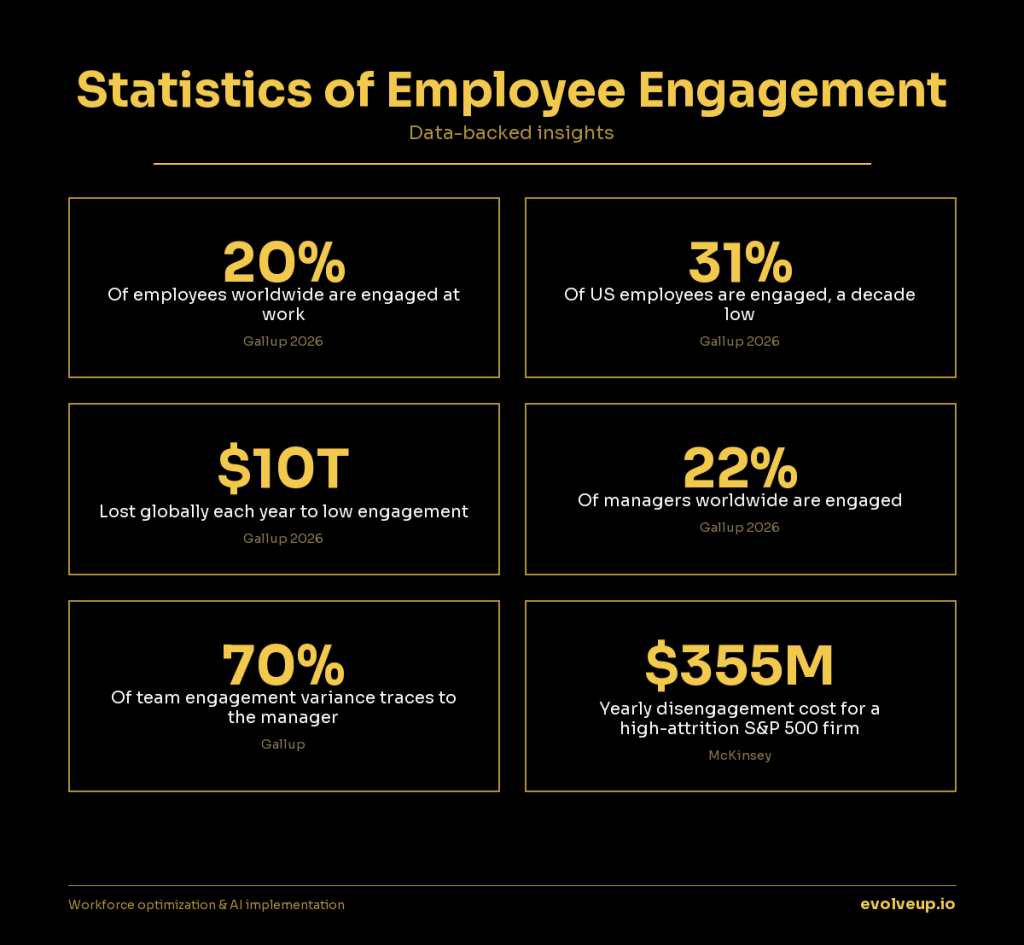
 Gallup’s 2026 State of the Global Workplace report found that only 20% of employees worldwide are engaged at work, with 64% not engaged and another 16% actively disengaged [1]. Roughly four out of every five workers are emotionally checked out to some degree [4].

The U.S. picture is slightly better, but still bleak. Only 31% of American employees were engaged in 2024, matching the lowest mark Gallup has recorded in a decade and a five-point drop from the 2020 peak of 36% [3]. Each percentage-point swing in U.S. engagement represents about 1.6 million workers. That means the decline since 2020 has cost the economy roughly eight million engaged employees [3].

The bright spot is what best-practice organizations achieve. These workplaces average 70% employee engagement, more than triple the global rate and a clear signal that the engagement crisis is solvable [14]. Globally, every percentage-point change in engagement represents around 21 million workers moving in or out of the engaged group [2].

The Business Cost of Disengagement

The financial toll of disengaged employees is staggering. Gallup estimates that low engagement cost the global economy about $10 trillion in lost productivity last year, equal to 9% of global GDP [1]. If every organization could reach the engagement levels of today’s best-practice companies, the world economy could grow by an additional $9.6 trillion [1].

At the company level, McKinsey calculates that employee disengagement and attrition cost a median-size S&P 500 company between $228 million and $355 million in lost productivity each year [8]. Stretch that out over five years, and the cumulative damage hits at least $1.1 billion in lost value per company [8]. In the United States alone, Gallup pegs the cost of disengagement at roughly $2 trillion in lost productivity annually [6].

How Engagement Drives Business Performance

Engagement is not a soft HR metric. Gallup’s meta-analysis, which compared top-quartile business units to bottom-quartile ones, found that highly engaged workplaces outperform disengaged ones across nearly every operational measure [5].

The profit and productivity gains are direct. Engaged business units report 23% higher profitability, 18% higher productivity in sales, and 14% higher productivity in production records and evaluations [5]. They also see 10% higher customer loyalty and engagement scores than their disengaged counterparts [5].

The risk-reduction numbers are just as striking. High-engagement workplaces see 78% less absenteeism, 21% less turnover in high-turnover organizations, and 51% less turnover in low-turnover ones [5]. They report 63% fewer safety incidents, 32% fewer quality defects, and 28% less theft and shrinkage [5]. These workforce optimization gains compound across operations, turning engagement from an HR metric into a board-level performance lever.

The Manager’s Role in Employee Engagement

Managers shape engagement more than any other workplace factor. They’re also the group disengaging fastest. Manager engagement globally fell from 27% to 22% between 2024 and 2025, the largest single-year drop on record [1]. Female managers lost 7 percentage points and managers under 35 lost 5 points, the steepest declines of any leadership cohort [1].

Inside best-practice organizations the pattern flips. 79% of managers are engaged at work, nearly four times the global average and the strongest evidence that organizational design, not individual willpower, drives manager engagement [1].

The fundamentals are slipping too. Only 46% of U.S. employees can clearly state what’s expected of them at work, and only 30% strongly agree that someone at work encourages their development [3]. Deloitte’s 2025 Global Human Capital Trends survey of nearly 10,000 leaders found that 72% of workers and 61% of managers don’t trust their organization’s performance management process. Only 26% of organizations rate their managers as very or extremely effective at enabling team performance [9].

Recognition and Employee Engagement

Recognition is one of the cheapest and most underused levers leaders have for raising engagement. Joint research from Gallup and Workhuman found that well-recognized employees were 45% less likely to have turned over two years later. Employees who strongly agree they get valuable feedback at work are five times more likely to be engaged [7].

Skill development also drives retention. Workers whose organizations encourage them to learn new skills are 47% less likely to be searching or watching for another job [7]. On the flip side, 14% of detached U.S. employees cite the lack of feedback, recognition, or development as a primary reason they have checked out [6]. Only 39% of U.S. employees strongly agree that someone at work cares about them as a person, a basic recognition signal that Gallup ties directly to engagement [3].

Remote, Hybrid, and In-Office Engagement

Engagement varies by work location, but not in the simple “remote vs office” pattern many leaders assume. Globally, fully remote employees show the highest engagement at 31%. Hybrid workers and on-site remote-capable workers tie at 23% each. On-site non-remote workers trail at 19% [4].

The labor market signals matter too. 52% of employees globally say now is a good time to find a job in their local area [4]. In the United States, 51% of employees are actively looking for a new role or watching for openings, but only 19% say they are extremely satisfied with their current employer [6]. Among U.S. workers who feel detached, 44% of Gen Z employees and 41% of remote workers describe their workplace as isolated or impersonal, suggesting disengagement and loneliness move together for younger and remote-first staff [6]. These location-based gaps point to the importance of designing a deliberate employee experience for distributed teams, not assuming engagement will follow flexibility on its own.

Wellbeing, Burnout, and Engagement

Wellbeing tracks engagement closely. Both are slipping. Only 34% of employees globally rate their lives as thriving. Another 56% are struggling, and 9% are suffering [4]. 40% of employees experienced significant stress the day before being surveyed. Roughly 22% reported loneliness, 23% reported sadness, and 22% reported anger as daily emotional states [4].

Leaders aren’t exempt from the strain. Managers report higher engagement than individual contributors, but they also report significantly higher stress (+7 percentage points), anger (+12), sadness (+11), and loneliness (+10), according to Gallup’s 2026 report [1]. The combination of higher engagement and worse mental health points to a workforce where the people most invested in their jobs are also the most likely to burn out.

Job Satisfaction and Generational Trends

The job satisfaction picture in 2025 looks contradictory. The Conference Board surveyed 1,700 workers and found that overall satisfaction jumped 5.7 percentage points in a single year. That’s the biggest increase since the survey launched in 1987, with workers reporting higher satisfaction across 26 of 27 elements measured [11]. For the first time in 22 years, work-life balance overtook compensation as the top workplace motivator, with 28% of employees ranking balance first compared to 27% for pay [11].

But that rebound did not reach younger workers. Only 57.4% of U.S. workers under 25 report being satisfied with their jobs, compared to 72.4% of those 55 and older. That’s the widest generational gap on record [12]. The broader labor market has cooled too. The U.S. quits rate dropped to 1.9% in April 2026, down from pandemic-era highs and signaling a tighter market where disengaged workers tend to stay put rather than leave [13].

AI and the Future of Employee Engagement

AI is reshaping engagement faster than most companies can keep up. This wave of workforce transformation is widening the gap between leaders and the front line. Microsoft’s 2025 Work Trend Index surveyed 31,000 workers across 31 countries. It found that 80% of the global workforce lacks the time or energy to do its job, but 53% of leaders say productivity has to rise [10]. Microsoft 365 telemetry shows employees are interrupted by a meeting, email, or chat ping roughly every two minutes during the workday [10].

Early AI adoption appears to lift engagement. At “frontier firms” (early-AI-adopter companies), 71% of workers say their company is thriving, compared to 37% globally [10]. The awareness gap is wide, though. 67% of leaders report familiarity with AI agents, but only 40% of employees say the same [10].

Anxiety about AI is climbing too. 18% of U.S. employees now say it’s somewhat or very likely their job will be eliminated in the next five years, up from 15% two years earlier. The figure climbs to 23% in organizations that have already implemented AI, and to 32% in finance and insurance, and 31% in technology [2]. Even with the worry, Deloitte found that more than 70% of managers and workers are more likely to join and stay with an organization whose employee value proposition helps them thrive in an AI-driven world [9]. Taken together, these employee engagement statistics show a workforce in transition, where AI is accelerating both the risks and the opportunities for leaders willing to act on the data.

Sources

  1. [1] Gallup. “State of the Global Workplace 2026 | Employee Engagement Data & Trends.” Gallup, 2026, https://www.gallup.com/workplace/349484/state-of-the-global-workplace.aspx.
  2. [2] Gallup. “Global Employee Engagement Continues Decline.” Gallup, 8 Apr. 2026, https://www.gallup.com/workplace/708071/global-employee-engagement-continues-decline.aspx.
  3. [3] Gallup. “U.S. Employee Engagement Sinks to 10-Year Low.” Gallup, 14 Jan. 2025, https://www.gallup.com/workplace/654911/employee-engagement-sinks-year-low.aspx.
  4. [4] Gallup. “State of the Global Workplace | 2026 Global Data Summary.” Gallup, 2026, https://www.gallup.com/workplace/697904/state-of-the-global-workplace-global-data.aspx.
  5. [5] Gallup. “How to Improve Employee Engagement in the Workplace.” Gallup, n.d., https://www.gallup.com/workplace/285674/improve-employee-engagement-workplace.aspx.
  6. [6] Gallup. “Anemic Employee Engagement Points to Leadership Challenges.” Gallup, 6 Aug. 2025, https://www.gallup.com/workplace/692954/anemic-employee-engagement-points-leadership-challenges.aspx.
  7. [7] Gallup-Workhuman. “Workplace Recognition Research.” Gallup, n.d., https://www.gallup.com/analytics/472658/workplace-recognition-research.aspx.
  8. [8] McKinsey & Company. “Some Employees Are Destroying Value. Others Are Building It. Do You Know the Difference?” McKinsey & Company, 11 Sep. 2023, https://www.mckinsey.com/capabilities/people-and-organizational-performance/our-insights/some-employees-are-destroying-value-others-are-building-it-do-you-know-the-difference.
  9. [9] Deloitte. “2025 Global Human Capital Trends.” Deloitte Insights, 2025, https://www.deloitte.com/us/en/insights/topics/talent/human-capital-trends/2025.html.
  10. [10] Microsoft. “2025 Work Trend Index Annual Report: The Frontier Firm Is Born.” Microsoft, 23 Apr. 2025, https://news.microsoft.com/annual-work-trend-index-2025/.
  11. [11] The Conference Board. “Job Satisfaction 2025: US Worker Satisfaction Rebounds Sharply.” The Conference Board, 2025, https://www.conference-board.org/publications/job-satisfaction-2025-US-worker-satisfaction-rebounds-sharply.
  12. [12] The Conference Board. “Job Satisfaction Gap Widens Between Younger & Older Workers.” The Conference Board, 2025, https://www.conference-board.org/topics/job-satisfaction/press/job-satisfaction-2025.
  13. [13] U.S. Bureau of Labor Statistics. “Job Openings and Labor Turnover Summary – April 2026.” U.S. Department of Labor, 2026, https://www.bls.gov/news.release/jolts.nr0.htm.
  14. [14] Gallup. “Global Indicator: Employee Engagement.” Gallup, n.d., https://www.gallup.com/394373/indicator-employee-engagement.aspx.

More Content